loading-screen

AMDG Technical Analytics

Analytics

news-image

Technical Analysis by AMDG Team: BTC Time to Bullish

High Timeframe View: LMACD crossover just happened on the weekly chart which could signify a change in trend favoring an upside.


Low Timeframe View: Currently, BTC has broken out of the downtrend formed since November 2021 and sitting above the trendline. It seems like a Wyckoff Spring Test is forming. Watch out for the retest this coming week. A successful retest of the 19.3-19.4 trendline would bring prices up to 23+k. A failure or breakdown would see prices back to 18-18.5k. (Both are near term outlook targets.)


As per BTC chart on Binance, it paints a somewhat similar picture with a slightly different perspective. Point of Control (POC) @ 20140 for the current range (17.5-25k) seems to be acting as a resistance but BTC is currently retesting the trendline breakout from Nov highs. Reclaiming POC and consolidating above it would be a good sign to start looking at targets up north, between 22.5-25- 26.5-28k with the nearest target to hit as early as next week.


Be the first now. Join our Telegram bit.ly/amdgtoken

This Is Just The Beginning!

Read more
news-image

Technical Analysis by AMDG Team: BTC Bullish?

Macro outlook:
Last week's closing was a mixed bag for stocks & currencies due to Great Britain's pivoting to save the flailing GBP, sending stocks up for a while but still closing in the red. The weekly candle for DXY (USD demand) is looking to reverse but the market is still waiting for confirmation of this. If it reverses & cools down, we will see continued growth in the stocks & crypto market.


High Time Frame (HTF) view: BTC has been sitting on this price for 4 months & supply zone on the monthly candle (19.9-31.9k) ensures the price remains bracketed below May's lows. LMACD has shown a slight upturn in trend with reduced selling pressure last September (red turning to light red/pink). Comparing current trends with 2018, lmacd has gone down much lower due to sustained selling pressure that started as early as September 2021. This could signal an overextended run that has met its end.


Low Time Frame (LTF) view:
It seems that we are seeing a Wyckoff Accumulation play on the BTC CME chart with a descending wedge. A breakout above would send prices to 25.3-25.8. Invalidation of this plan would be a close below 18k. If it breaks below, monthly demand is around 14-16k.


Be the first now. Join our Telegram bit.ly/amdgtoken

This Is Just The Beginning!

Read more
news-image

Technical Analysis by AMDG Team: “Gravestone Doji” candle forming

Higher timeframe view to set the context: 2 months after the Pi Cycle Bottom indicator flashed the buy signal, we're seeing a “Gravestone Doji” candle forming this month. 


What is interesting is that it seems that we are getting a horizontal support on last cycle's all-time high of 19.6k for 4 months running. This month's candle looks to be a potential reversal on the higher timeframe.


Next, we'll look at the weekly chart to gauge what could possibly be the next move for BTC. Based on the VMC indicator, a buy signal flashed due to a price increase before the CPI results were released on 13 September. The market bottom indicator also denotes ease in selling pressure. Using the Logarithmic MACD oscillator, it does seem like a crossover is about to happen which could lead to positive prices.


End note: DXY could've topped out with a sell signal on VMC but current week's candle has canceled out last week's bearish hammer top. All the indicators are pointing toward a reversal but the market isn't buoyant yet as news of inflation & a recession has caused the market to remain very cautious. For now, it tends to remain flat/sideways till FOMC meets on 22 September at 12mn SGT. If the interest rates hike turns out at 75bps as expected, then we could see BTC price action to be neutral/slightly bullish with no expected sell-off.

Current supports: 19.5k, 18.5k, 17.6k. If it breaks the 17.6k support line, a downward spiral to 13.4k is likely.

Current resistances: 20.7k, 22.5k, 24.5k.

We've flipped 19.5k zone many times, suggesting this could be strong support if the price maintains above, or a strong resistance if the price goes below.


Be the first now. Join our Telegram bit.ly/amdgtoken

This Is Just The Beginning!


Read more
news-image

Technical Analysis by AMDG Team: Closing daily BTC 21.9 K

This chart was drawn last week. We were expecting price consolidation where BTC price goes sideways in a tight range (black squiggly line) but we drew 2 other paths that were possible.


It seems that BTC has chosen to go up & follow the orange line's path. There is a divergence forming (VMC indicator green dot with a black line joining) where volume is much higher now, most likely due to past week's liquidation event after BTC price dipped below 19k.

At the moment, the daily chart's looking 50-50 based on indicators but an evening star candle is forming at the moment. If this plays out, the orange line's path is more likely to happen with last week's lows possibly taken out. Take note that this could happen on 13 Sept, when FOMC sits for a meeting.

Invalidation would be closing daily above parallel channel above 21.9k


Be the first now. Join our Telegram bit.ly/amdgtoken

This Is Just The Beginning!

Read more
news-image

Technical Analysis by AMDG Team: Market Bullish or Bearish

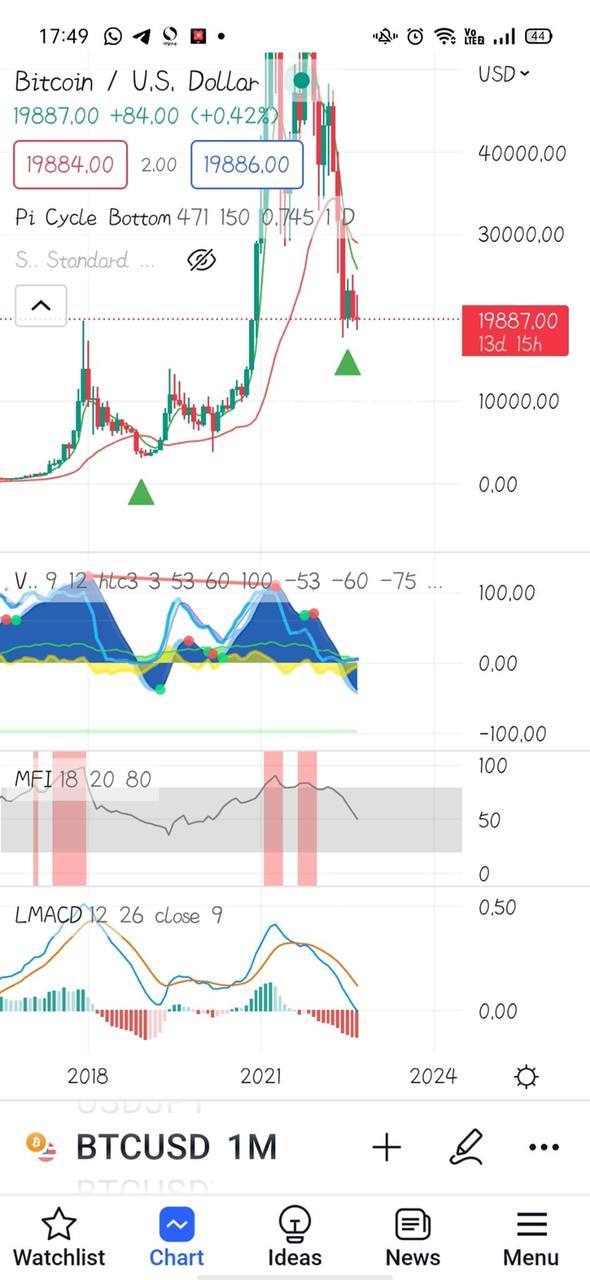
Here is the 2018 Pi Cycle Bottom & the last time it got close to bottom price is 54 days after the bottom.


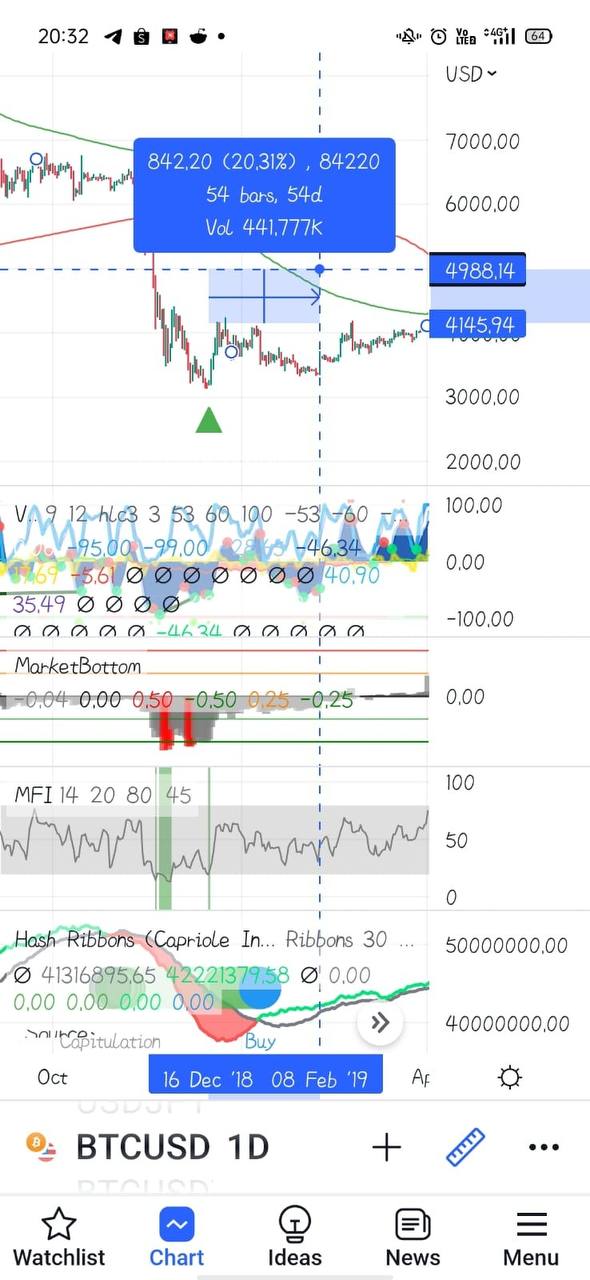
Pi Cycle Bottom 2022 has been printed on 13 July. If price action were to match 2018,  5 Sep would be the last day for us to buy near bottom prices.


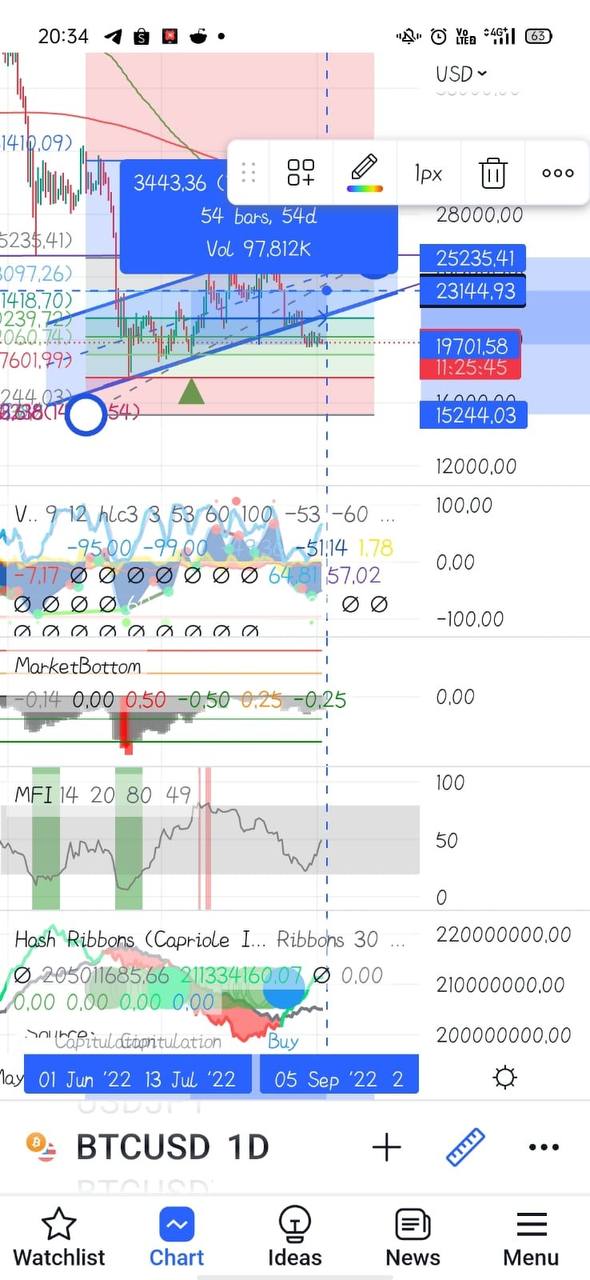
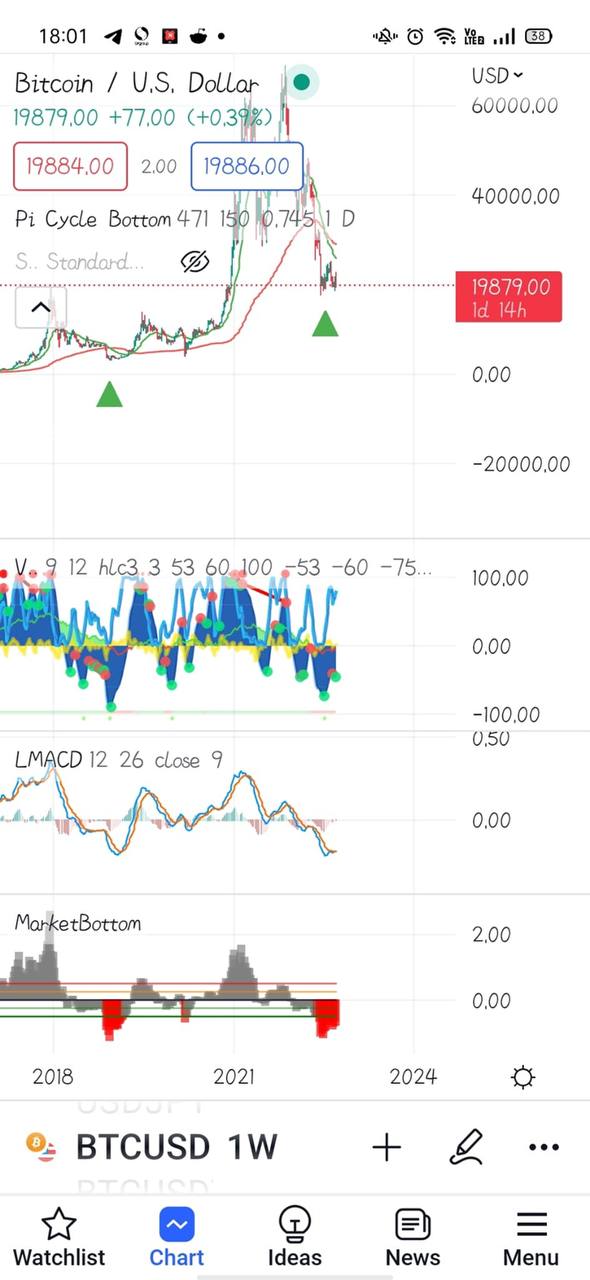
From the analysis, one of the 3 scenarios might play out for BTC: 

1. (Blue Arrow) Price goes to June's bottom at around 17.6k for a double bottom. It seems unlikely at this point as it'd present buyers/longs to open below Pi Cycle bottom.

2. (Yellow Arrow) For this to work out, we should see the price being rejected off the parallel channel near Fib retracement 0.618 @ 21400+. If the price is rejected there, we would go back to range lows of 19k before any further positive price action.

3. (Black Squiggly) This scenario denotes that the bottom is in and sideways consolidation is here to shake out retail.

In any case, all scenarios will point towards 23-25k.

On daily chart, we've crossed below parallel channel. 

This could mean 2 things:

1. Deviation to take out late "Long"-ers. Price will go back up next week to clear 21.4k.

2. Rejection off the parallel channel would mean we will see 21.4k first then 19k.

If you're a trader, wait between 5-12 September to not get caught out/stuck in any trades.

If you're an investor, we're closer to the bottom than to the top.


Be the first now. Join our Telegram bit.ly/amdgtoken

This Is Just The Beginning!

Read more
news-image

Technical Analysis by AMDG Team: June's bottom price is sometime between the 5th to 12th of September

BTC is still within the parallel channel from last June's low & was rejected off the midline of the parallel channel yesterday. 


Fibonacci retracement shows that BTC is at 0.618, which suggests that it was a healthy corrective move. Money Flow Index (MFI) is at 34, which means that BTC is close to being highly oversold on the daily.

So far, no negative news other than the last FOMC news last Wed, which was neither hawkish or dovish. It does seem like the market was trying to price in this piece of news when it comes on Sept 12, as the move seems 2 days delayed.

On the counter, breaking the parallel channel would mean the price would revisit 17-19k.

If we were to follow the PI Cycle Bottom indicator, which marks out halving cycles bottoms, the bottom is in. 

Chances are that we could revisit close to June's bottom price sometime between the 5th to 12th of September.


Be the first now. Join our Telegram bit.ly/amdgtoken

This Is Just The Beginning!

Read more

Want to be the first to know?

If you don't want to be left behind and want to know our technical analysis, please join our telegram community.

How-to guides

If you have any questions about our technical analysis, please join our community on Telegram, post your questions there, we will be happy to answer all your questions.

AMDG Digital Eco-System