


Technical Analysis by AMDG Team: “Gravestone Doji” candle forming
Higher timeframe view to set the context: 2 months after the Pi Cycle Bottom indicator flashed the buy signal, we're seeing a “Gravestone Doji” candle forming this month.
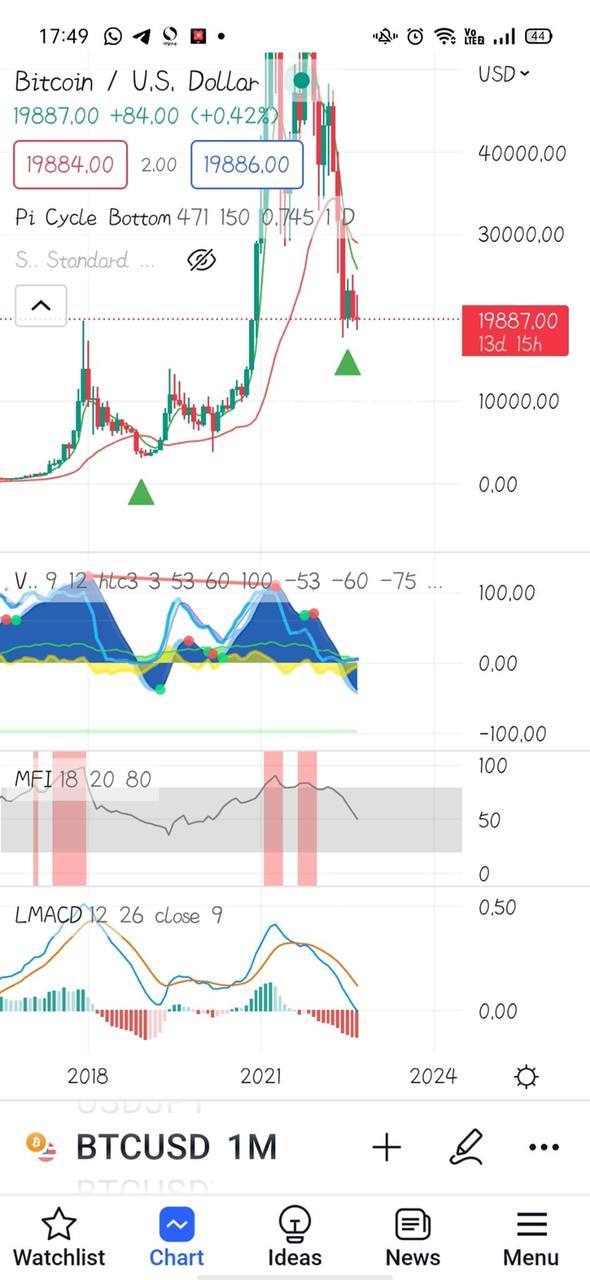
What is interesting is that it seems that we are getting a horizontal support on last cycle's all-time high of 19.6k for 4 months running. This month's candle looks to be a potential reversal on the higher timeframe.
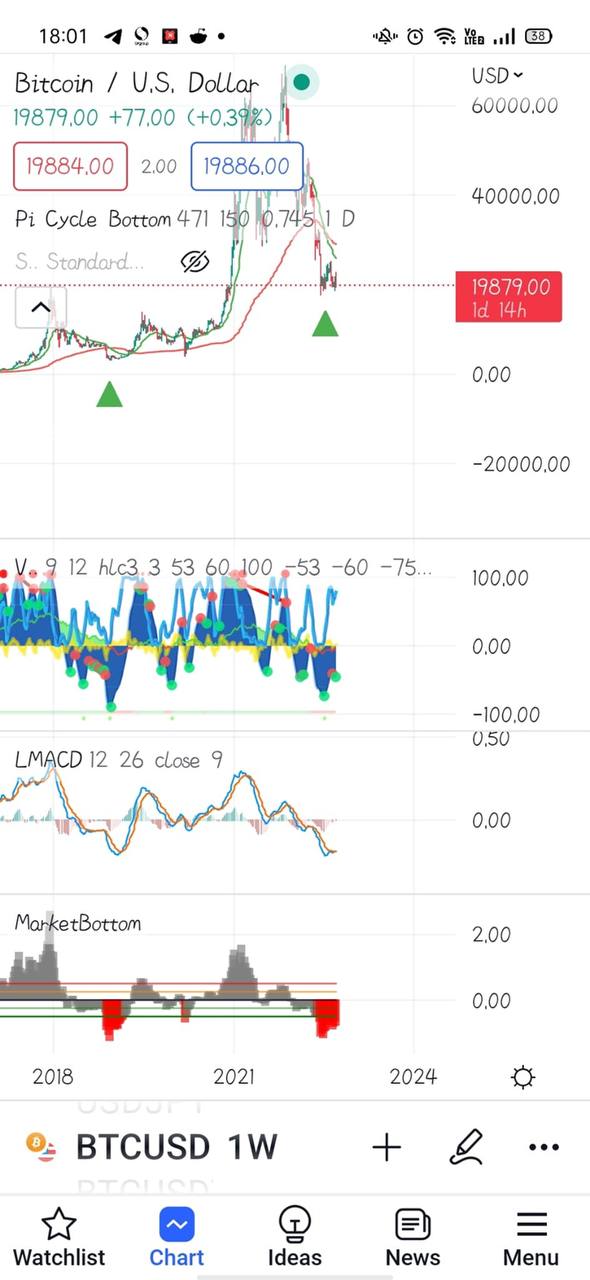
Next, we'll look at the weekly chart to gauge what could possibly be the next move for BTC. Based on the VMC indicator, a buy signal flashed due to a price increase before the CPI results were released on 13 September. The market bottom indicator also denotes ease in selling pressure. Using the Logarithmic MACD oscillator, it does seem like a crossover is about to happen which could lead to positive prices.
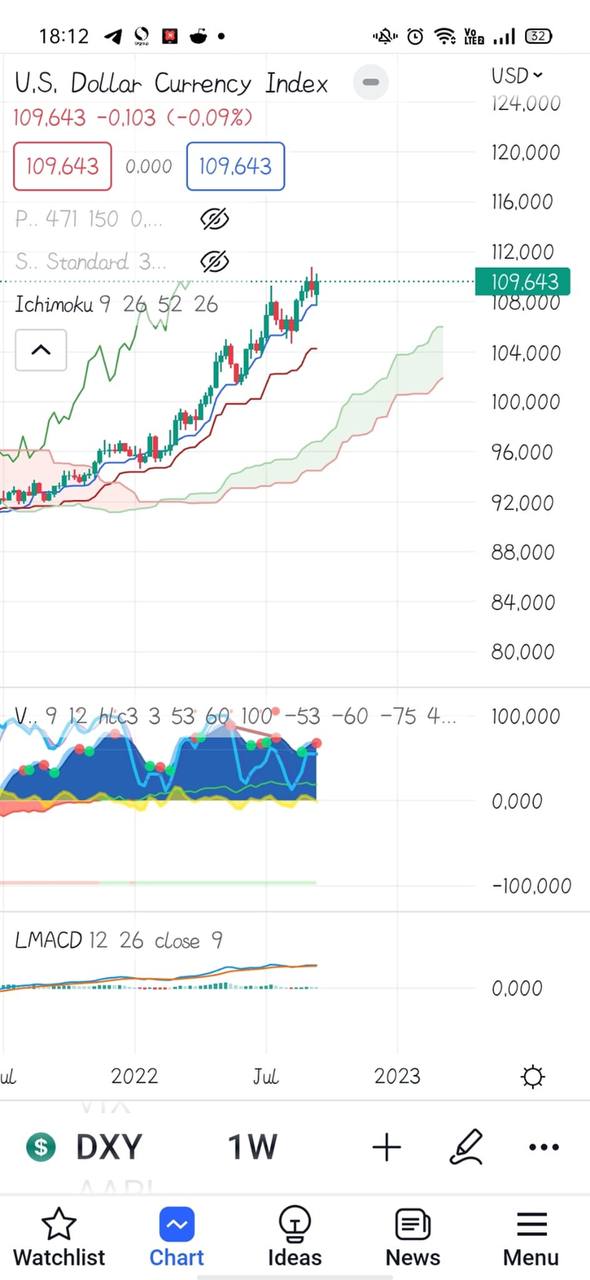
End note: DXY could've topped out with a sell signal on VMC but current week's candle has canceled out last week's bearish hammer top. All the indicators are pointing toward a reversal but the market isn't buoyant yet as news of inflation & a recession has caused the market to remain very cautious. For now, it tends to remain flat/sideways till FOMC meets on 22 September at 12mn SGT. If the interest rates hike turns out at 75bps as expected, then we could see BTC price action to be neutral/slightly bullish with no expected sell-off.
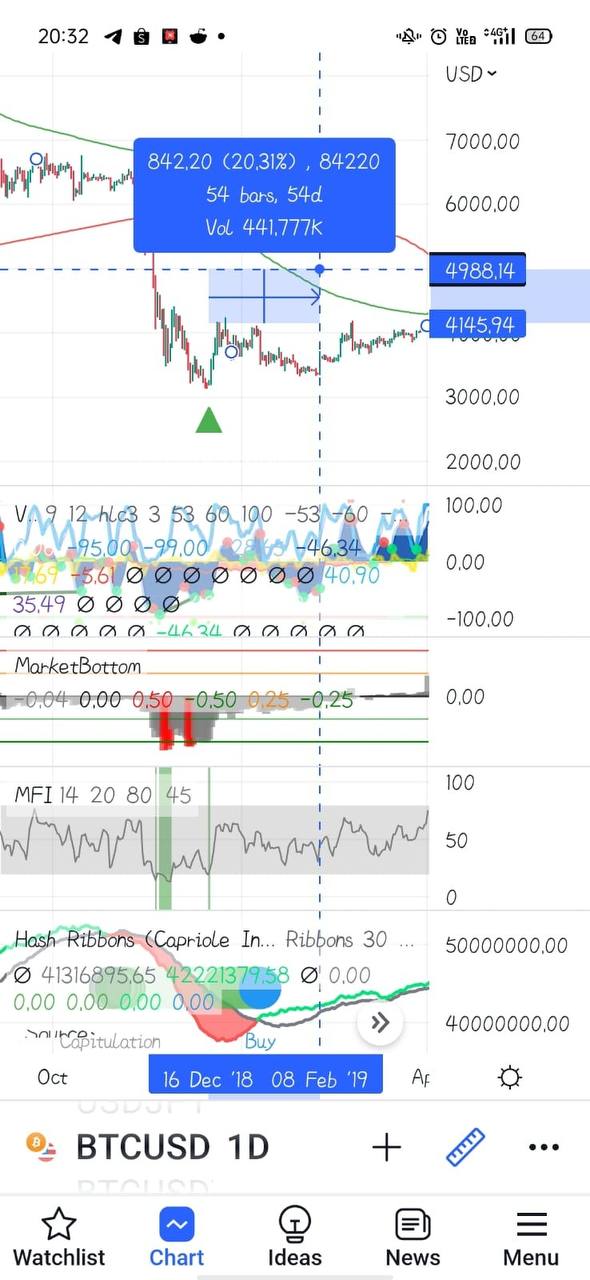
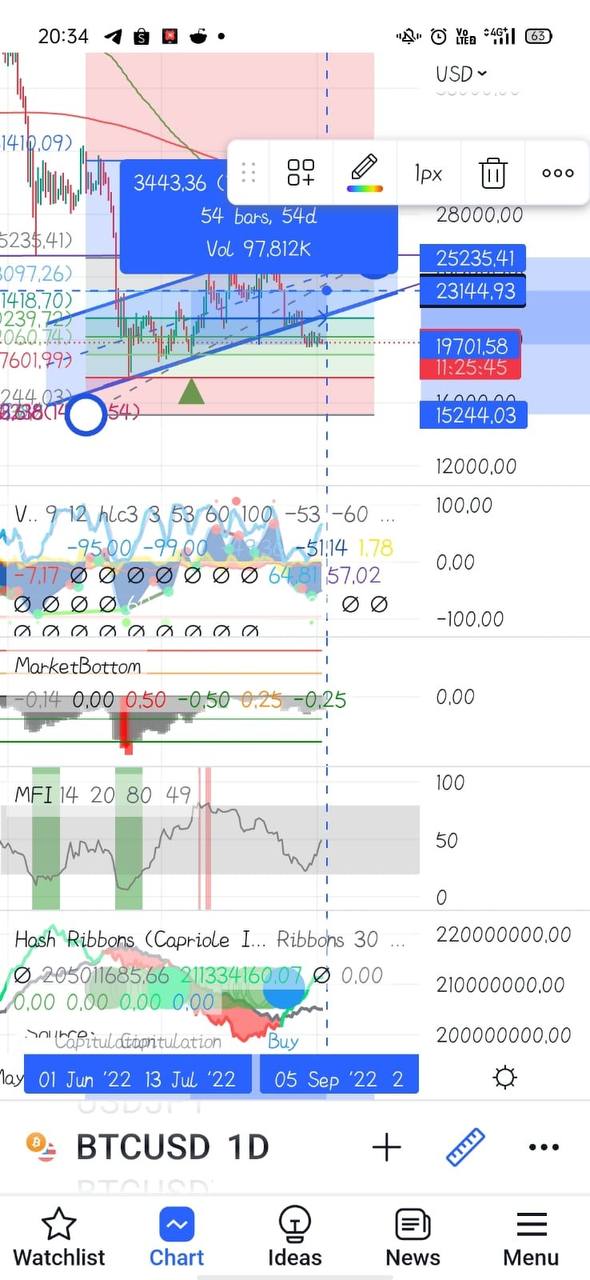
Current supports: 19.5k, 18.5k, 17.6k. If it breaks the 17.6k support line, a downward spiral to 13.4k is likely.
Current resistances: 20.7k, 22.5k, 24.5k.
We've flipped 19.5k zone many times, suggesting this could be strong support if the price maintains above, or a strong resistance if the price goes below.
Be the first now. Join our Telegram bit.ly/amdgtoken
This Is Just The Beginning!